App Start
Upon launching the application, users are greeted with a comprehensive list of available modules/applications. Additionally, the interface includes a search input box, enabling users to swiftly locate and select the desired module. This search functionality enhances user experience by dynamically filtering the list of modules in real-time, corresponding to the user’s input in the search box.

Since the MVP has a Data Analysis module/application, it is assumed the user selected that one from the list.
Data Analysis Module
Data Ingestion
When opting for the Data Cleaning module, users are presented with two distinct choices. The first option allows for the importation of an existing dataset from a shared repository. Alternatively, users have the capability to upload a dataset to this shared repository. Uploading a dataset not only stores it in the repository but also automatically imports it into the current app session, streamlining the data integration process.
 Upon the importation of a dataset into the application, several automatic data cleaning functionalities are initiated to ensure data quality and consistency. These include:
-
Date and Time Conversion: This crucial step involves standardizing all timestamps to a consistent format. It encompasses handling various time zones, accommodating daylight saving time adjustments, and, if required, converting date-time formats to maintain uniformity across the dataset.
-
Removing Duplicates: To prevent skewed analysis and enhance data integrity, the system automatically identifies and removes any duplicate records. This process is a standard procedure, aimed at ensuring the dataset’s accuracy and reliability for subsequent analysis.
Data Cleaning
Once the dataset is imported and rendered, users have the flexibility to toggle between two distinct views. The first view presents a Table form, helping users to understand the nature of their dataset.

Table View
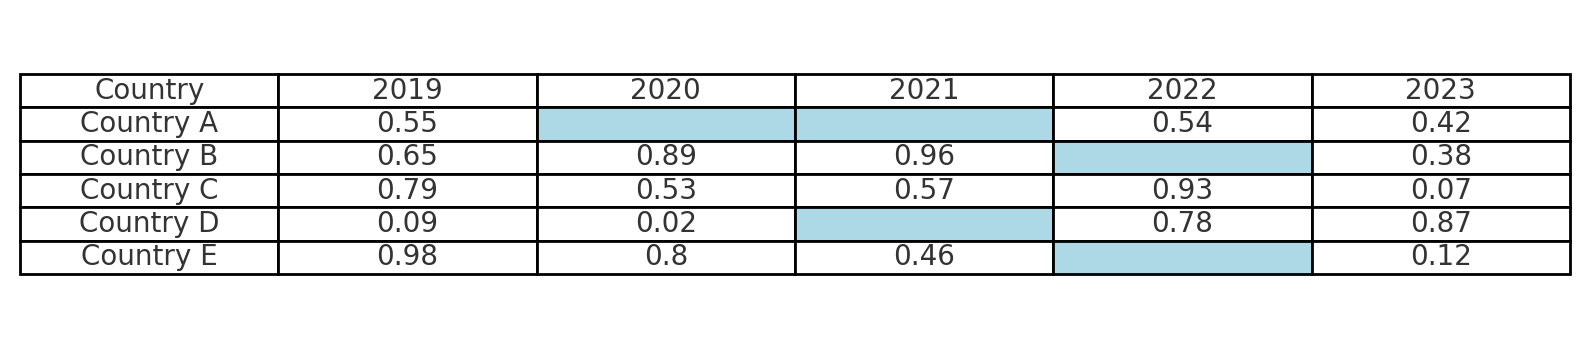
In the table view, an array of intuitive helpers assists users in efficiently filling out the data cleaning form:
-
Color-Coded Cells: Cells containing missing values are highlighted in a distinct color, light blue, for quick and easy identification.
-
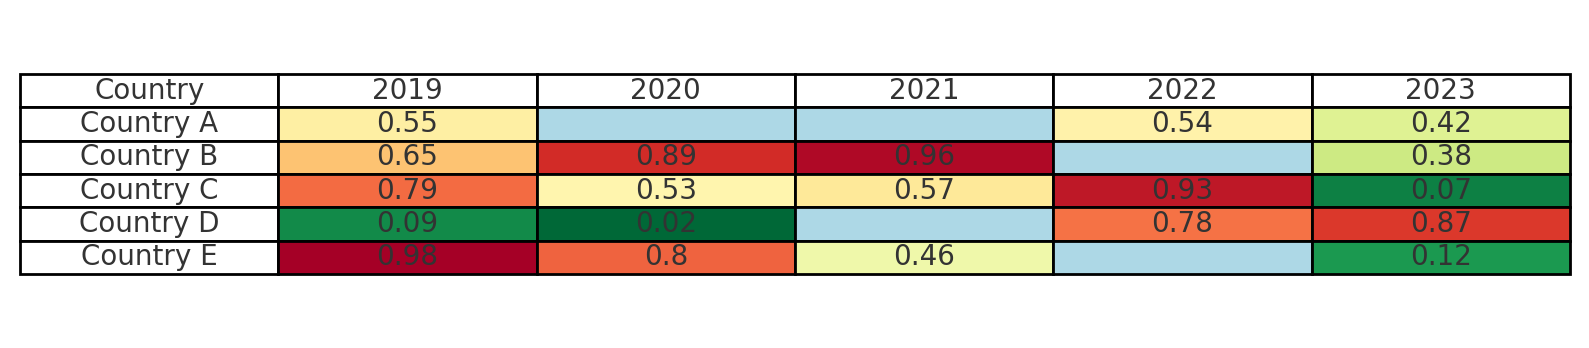
Conditional Formatting: Gradient colors are applied across columns to visualize the range of values, effectively pinpointing outliers and illustrating data distributions. Gradient colors range from light green to dark red. The smallest value in the dataset is of light yellow color, and the highest is of dark red color.
-
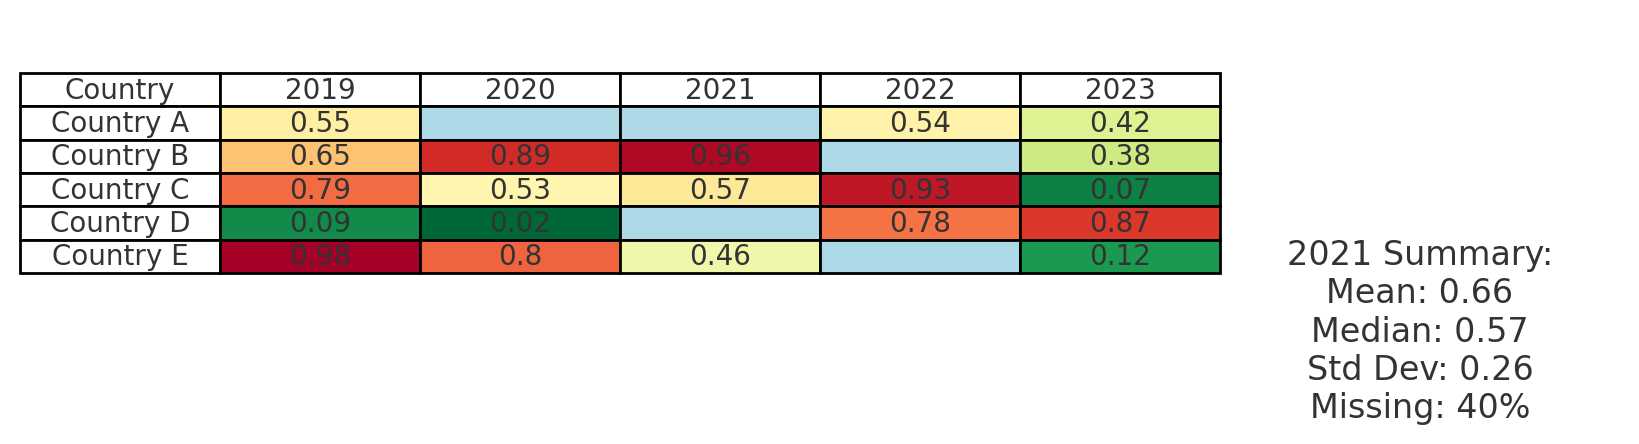
In-Table Summary Statistics: Essential summary statistics, including mean, median, standard deviation, and the percentage of missing values, are displayed for a clicked row or a column.
Form View

In the form view, a comprehensive form emerges, allowing users to meticulously specify their data cleaning preferences. Upon confirmation, the specified data cleaning operations are executed on the dataset.
-
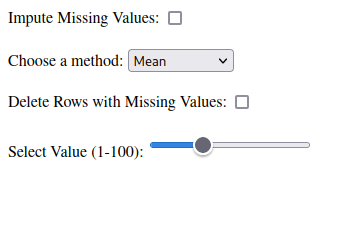
Handling Missing Values
- Impute Missing Values:
- Method of Imputation: [Dropdown options include ‘Mean’, ‘Median’, ‘Interpolation’]
- Delete Rows/Columns with Missing Values:
- Threshold for Deletion (as a percentage of missing values in a row/column): [Slider or Numeric Input ranging from 0% to 100%]
- Impute Missing Values:
-
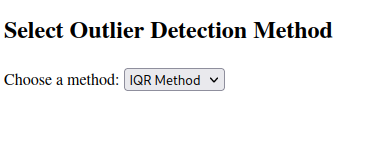
Filtering Outliers
- Identify and Address Outliers:
- Outlier Detection Method: [Dropdown options include ‘Z-score’, ‘IQR’]
- Action on Outliers: [Dropdown options include ‘Remove’, ‘Cap/Floor’, ‘Adjust’]
- Identify and Address Outliers:
-
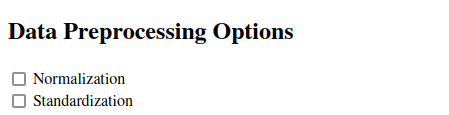
Normalization and Standardization
-
Normalize Data: [Checkbox]
-
Standardize Data: [Checkbox]
-
-
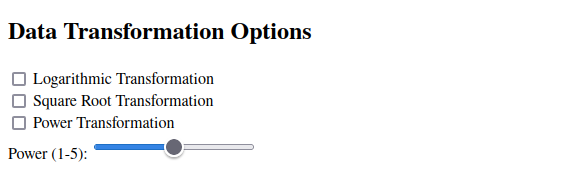
Data Transformation
-
- Transformation Type: [Checkboxes include ‘Logarithmic’, ‘Square root’, ‘Power’ (comes with a slider for power, between 1 and 5)]
-
-
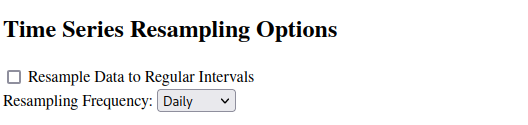
Handling Irregular Time Series
- Resample Data to Regular Intervals: [Checkbox]
- Resampling Frequency: [Dropdown options include ‘Daily’, ‘Weekly’, ‘Monthly’]
- Resample Data to Regular Intervals: [Checkbox]
-
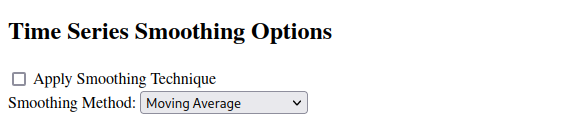
Smoothing Time Series
- Apply Smoothing Technique: [Checkbox]
- Smoothing Method: [Dropdown options include ‘Moving average’, ‘Exponential smoothing’]
- Apply Smoothing Technique: [Checkbox]